

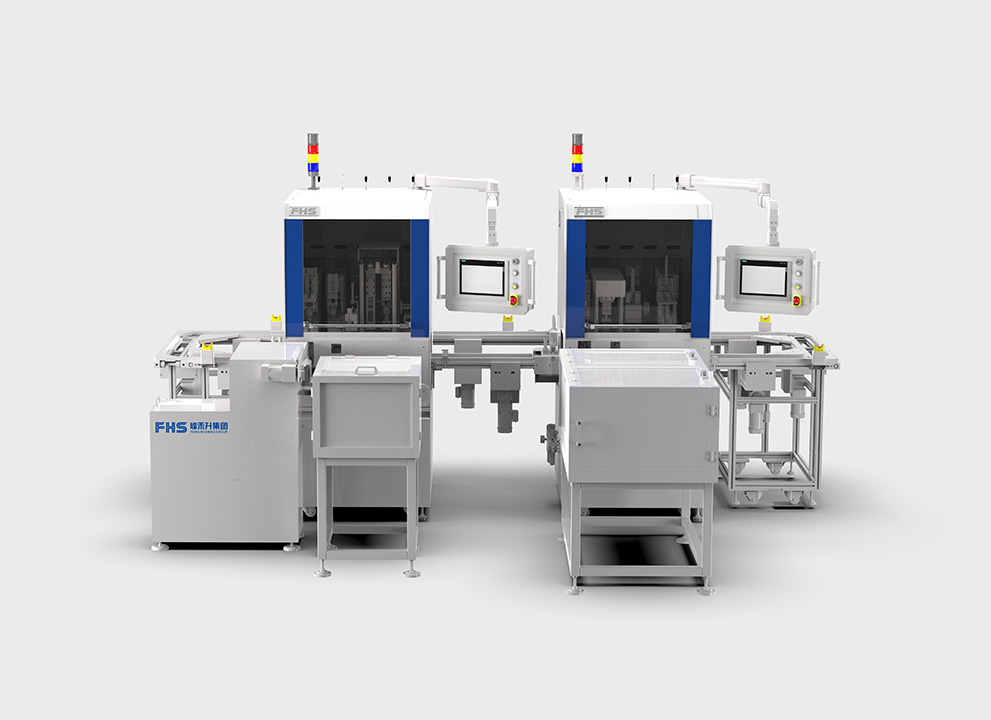
Why a direct comparison matters
Deciding between assembly approaches requires more than price tags and vendor pitch decks; you need a side-by-side view that shows where value accumulates and where costs repeat. This piece walks you through metrics and trade-offs so you can compare options for medical device assembly automation on their true business merits.

What “lifecycle value” and “total cost” actually measure
Think of lifecycle value as the sum of benefits realized over the life of the system: uptime, yield, quality improvements, regulatory resilience, and speed-to-volume. Total cost of ownership (TCO) bundles one-time and recurring expenses: capital equipment, qualification and validation, spare parts, consumables, software licenses, maintenance labor, and eventual decommissioning. Comparing the two highlights whether an investment pays off or just shifts costs around.
Key numbers and the right way to compare them
Use consistent, time-bound metrics. Compare over a realistic planning horizon (typically 5–10 years for assembly systems). Required figures:
– Initial capital and installation costs (including FAT/SAT).
– Validation and documentation effort tied to ISO 13485 and device-specific requirements.
– Annualized maintenance and support (parts + labor + software updates).
– Throughput gain measured as pieces per hour and first-pass yield improvement.
– Changeover and qualification time for new SKUs or design changes.
– Risk costs: rework, scrap, and potential regulatory remediation.
Three practical comparison scenarios
Lay out options side-by-side. Example scenarios that reveal different value profiles:
– Manual/bench assembly: low capital, high labor variability, low up-front validation but higher long-term risk and scale limits.
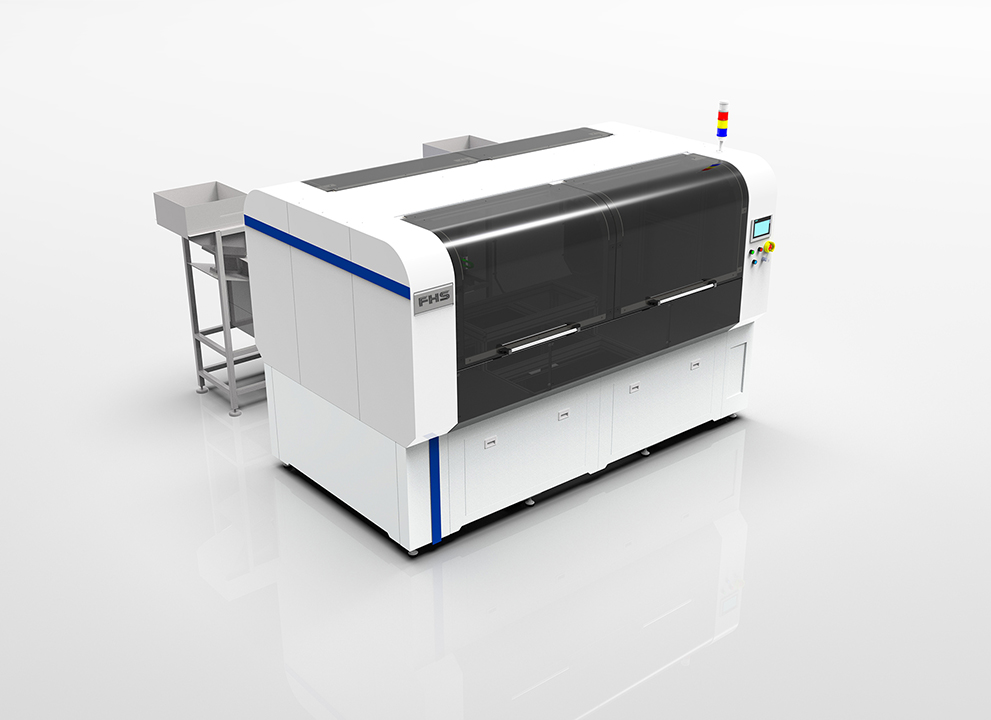
– Hybrid automation (robotic stations + manual ops): moderate capital, targeted quality gains, manageable validation scope, flexible for multiple SKUs.
– Fully automated line: high capital and validation burden, lowest per-unit labor and best repeatability, faster scale once stable.
Checklist for decision-grade evaluation
Run each candidate through this checklist to expose hidden costs and benefits:
– What validation scope will regulators expect for the chosen level of automation?
– Which maintenance tasks can internal staff cover and which need OEM service contracts?
– How much production variability (SKU mix, traceability needs) will remain in five years?
– How fast can the system recover from failures (MTTR) and how often do failures happen (MTBF)?
– Does the design permit incremental upgrades, or demand full replacement for capability changes?
Common mistakes that inflate TCO or undercut value
Teams often commit the same avoidable errors:
– Over-indexing on lowest upfront price and ignoring validation and change management effort.
– Treating automation as a one-off purchase instead of a capability that needs governance, spare parts, and trained operators.
– Assuming perfect yields from day one; integration and process drift demand planned tuning time and resources.
– Skipping vendor SLAs for mission-critical functions, then paying premium emergency fees later.
Practical comparisons that helped others
At major industry gatherings like MD&M West in Anaheim, engineers often map three-year break-even curves for hybrid versus full automation to justify staged investments. Those conversations show a pattern: when device complexity and traceability demands rise, the value curve for automation steepens faster than the cost curve, but only if teams budget validation and support correctly.
How to present your comparison to stakeholders
Use a simple matrix that aligns metrics with business questions: quality, capacity, time-to-market, and regulatory risk. Show a year-by-year cashflow for each option, with sensitivity bands for yield and downtime. Frame the narrative around specific outcomes—reduced rejects, predictable output, fewer inspection cycles—rather than vague efficiency promises.
Synthesizing the choice and next steps
Make decisions that match production reality: pick hybrid approaches when flexibility and lower validation overhead matter; go fuller when long production runs and tight traceability dominate. The right comparison exposes where to invest in validation, where to negotiate service terms, and where modular upgrades keep future costs down. For teams that need a grounded partner who knows assembly lines and regulatory workflows, FHS fits naturally into the conversation by helping translate lifecycle value into operational plans and realistic budgets.